Manage all your Terraform workspaces from a beautiful dashboard. Real-time logs, plan diffs, state browser, Git branch/tag selector, variable groups, variable origin tracing, workspace metrics, run notifications, REST API, and Sentinel policy enforcement — no cloud account, no SaaS fees.
From workspace discovery to policy enforcement — all the tools your infrastructure team needs, without a monthly bill.
Recursive workspace discovery from a root folder. Group folders rendered as a collapsible tree in the sidebar with search filter.
Run plan and apply with live log streaming over Socket.IO. Concurrent queue with up to N parallel workers.
Every resource change categorized as create / update / delete / no-op and displayed in a structured diff view with attribute-level detail.
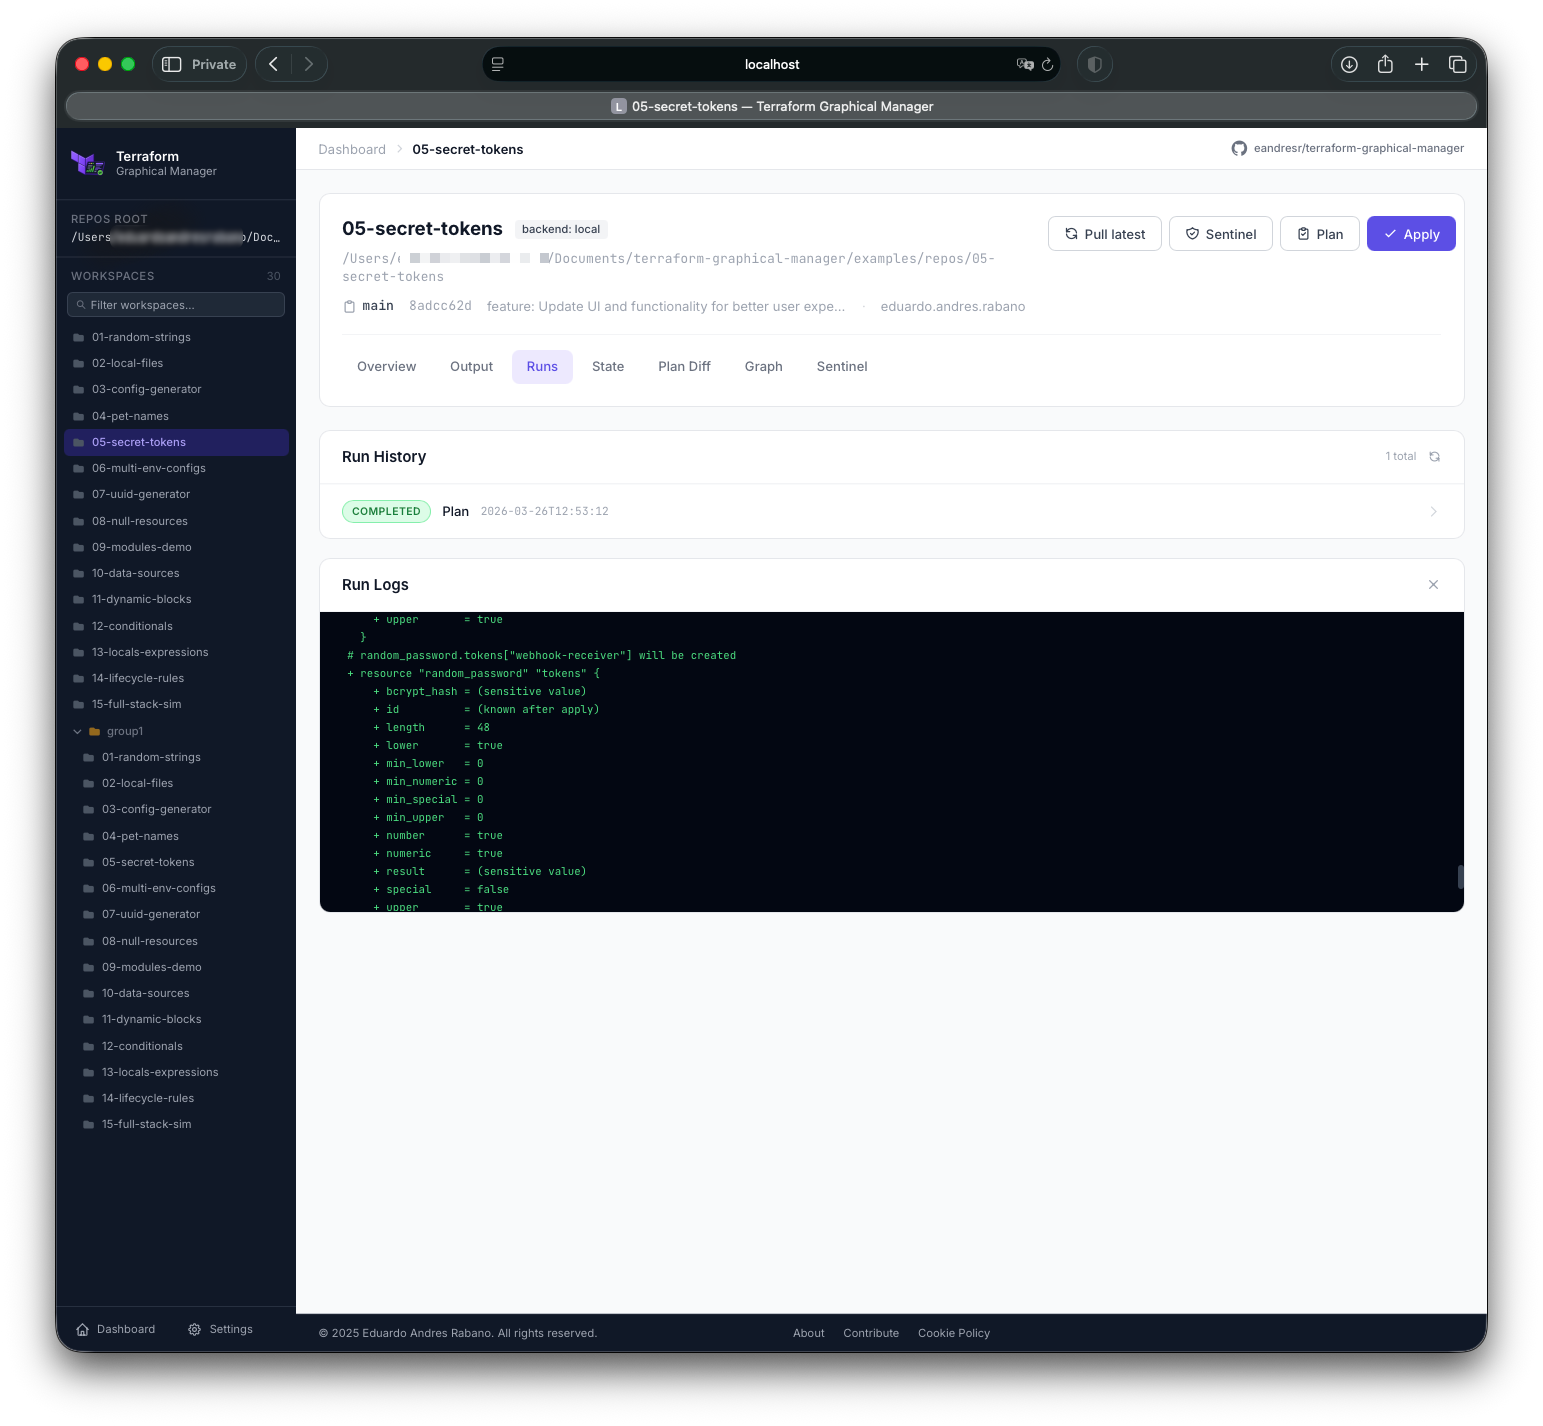
Pull and parse Terraform state. Browse resources and their attributes with sensitive values automatically masked in the UI.
Run plan -refresh-only on demand. Drift indicator shown prominently on workspace cards when infrastructure has drifted from state.
Interactive D3.js force-directed graph of your Terraform resource dependencies. Zoom, pan, and click nodes to inspect details.
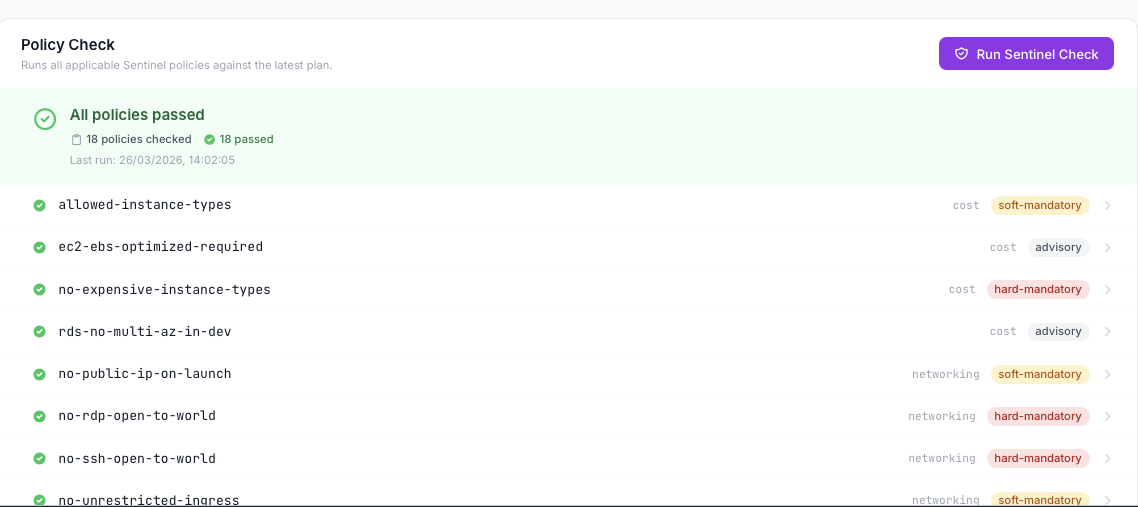
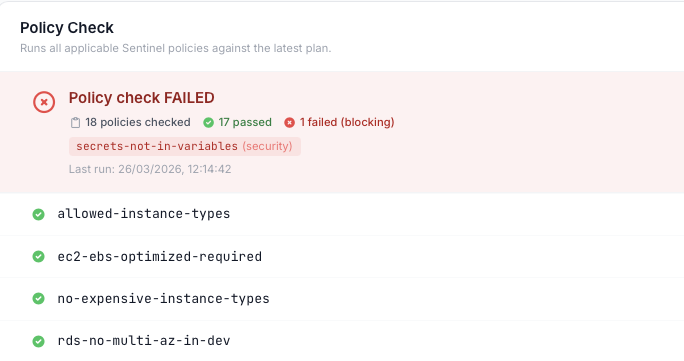
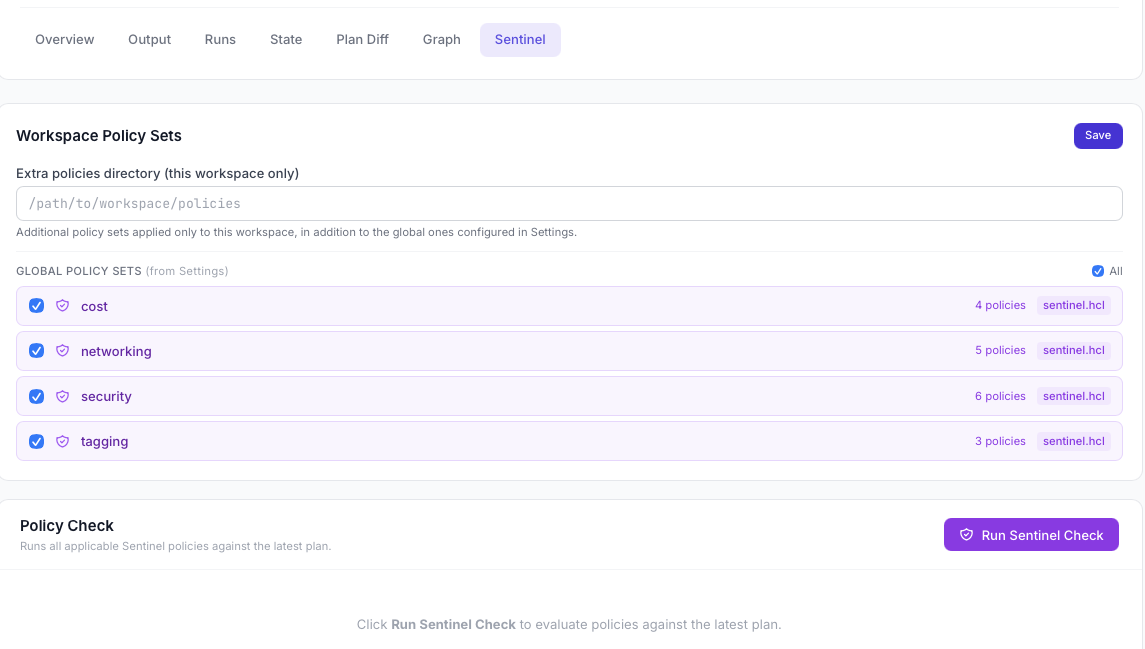
Evaluate HashiCorp Sentinel policies against every plan. Per-workspace policy sets, selectable policy checkboxes, and persistent last-run history.
Each execution gets its own clean environment — credentials are never inherited from the host shell or persisted to disk.
Manage multiple local Terraform binaries. Pin a version per workspace or override per run. Supports both dot and underscore directory naming.
Branch, tag, and release selector with search. Choose the exact Git ref per Run and see it recorded in the run history — something TFE/Terraform Cloud makes surprisingly hard.
Key-value Terraform and env variables scoped to a single workspace. Stored in workspace_config.json, encrypted at rest, and injected automatically on every run.
Named sets of Terraform/env variables applied to one or more workspaces — global or workspace-scoped. Sidebar panel with create/edit/delete and a "Used in workspaces" viewer.
Every Run shows exactly which variables were applied and where they came from: workspace var, variable group, .tfvars, auto.tfvars, or module default — no guesswork.
Per-workspace run counters, success/failure rates, plan duration, and resource change trends. Export to Prometheus, InfluxDB, or any compatible scraper via a built-in metrics endpoint.
Send run status alerts to email, Slack, PagerDuty, Alertmanager, or any webhook. Configurable per workspace — trigger on success, failure, or drift detection.
Built-in REST API to trigger plans, applies, and workspace queries programmatically. Evaluate automations, integrate with CI/CD pipelines, or build your own tooling on top of TGM.
Persist TerraGUI's own workspace registry, run history, and configuration in a remote store — AWS S3, Azure Blob, GCS, or any S3-compatible backend. Your Terraform .tfstate is untouched; this is about TerraGUI's data — encrypted at rest, auditable, and shareable across your whole team without extra infrastructure.
Optional password lock with Fernet-based encryption for sensitive variable values. Auto re-encryption when password changes. Safe "remove lock" modal with option to decrypt to plaintext.
Great for teams: share the portal password via your company password manager (1Password, Bitwarden, etc.) and every teammate runs with identical, encrypted variable config — zero drift, zero extra cost.
Explore every area of the interface — from the execution console to the Sentinel policy results.
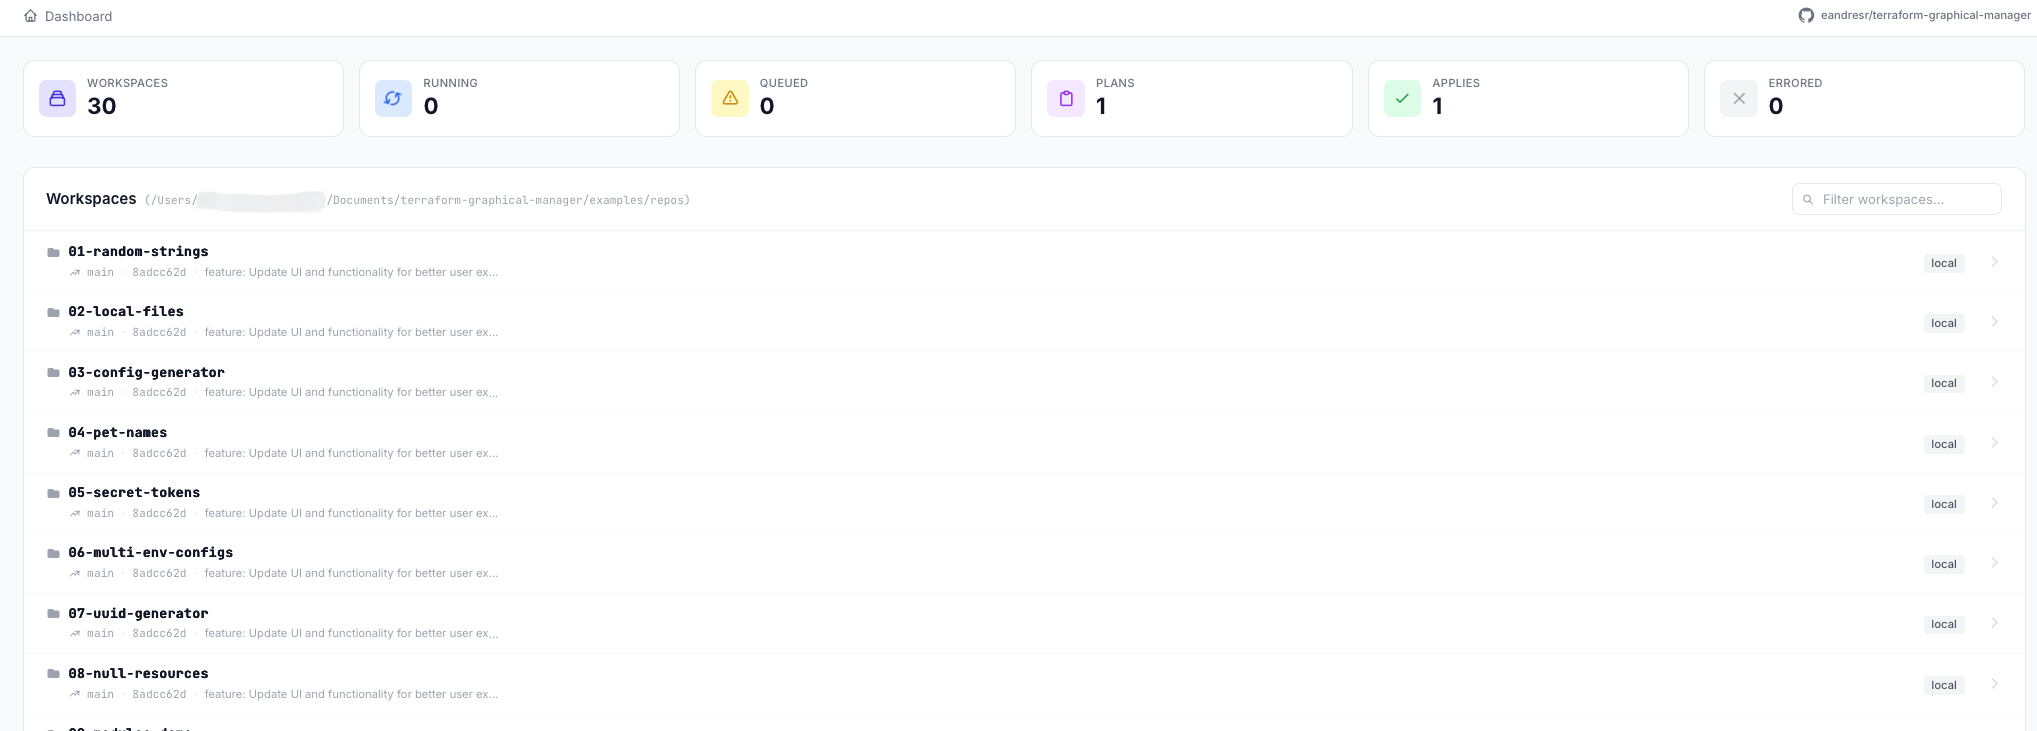
Stats, workspace cards, error spotlight — everything at a glance.
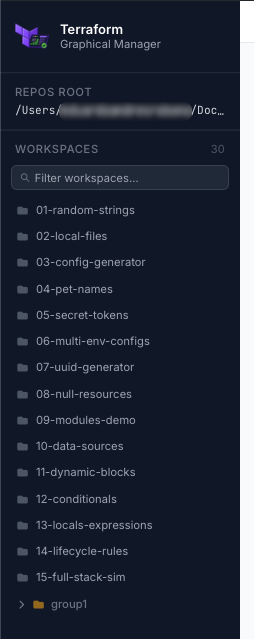
Group folders collapse/expand. Leaves link directly to their workspace.
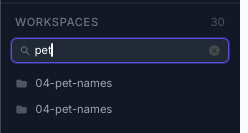
Filter workspaces by name across the entire tree in real time.
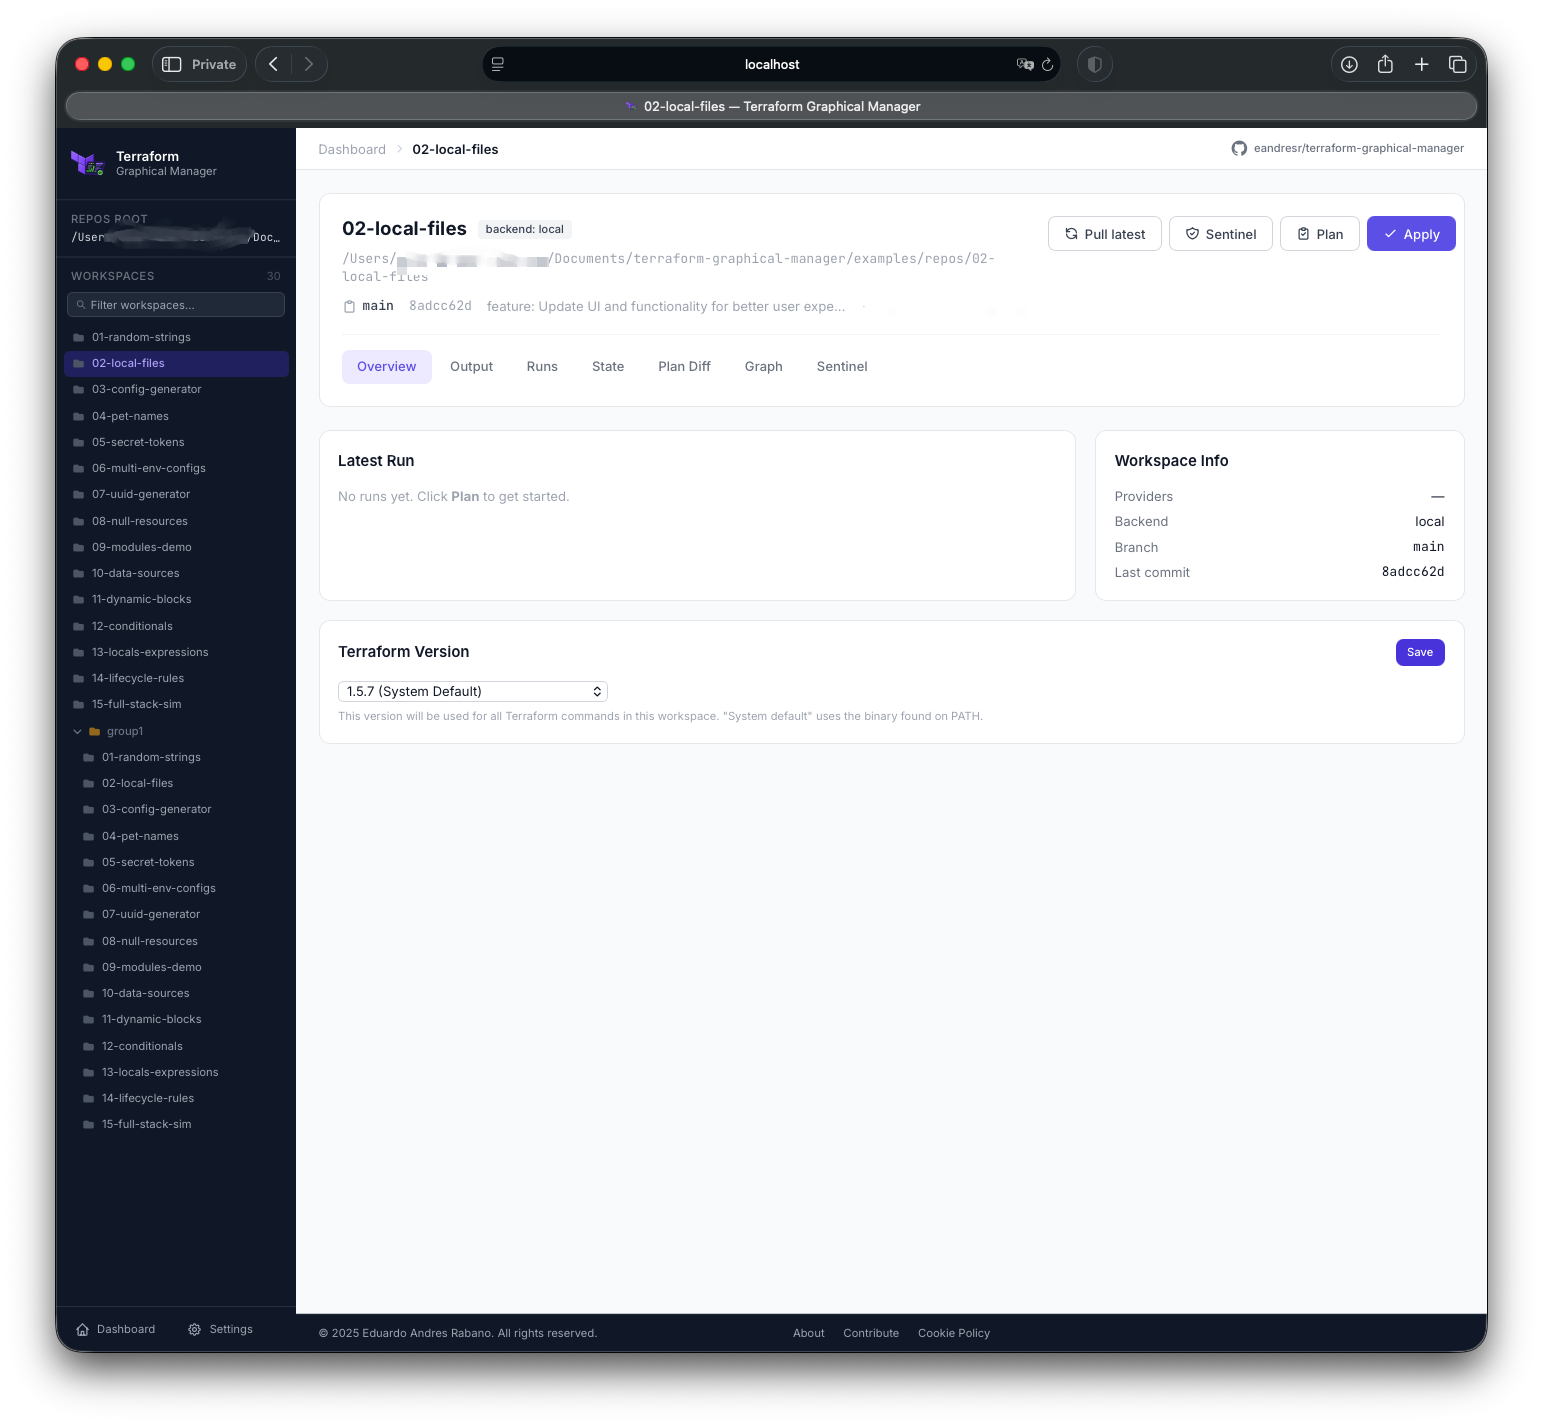
Providers, backend type, Git branch, last commit, version pin, and one-click Plan / Apply.
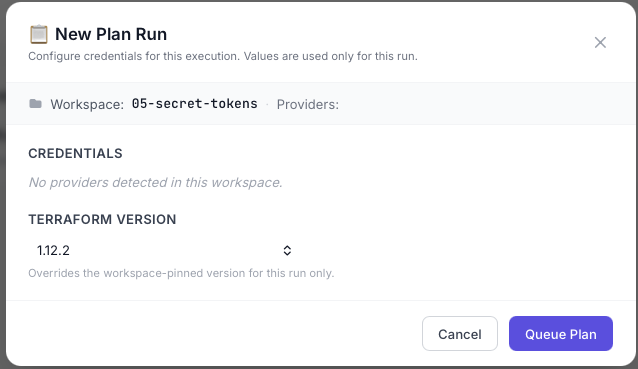
Inject credentials per run without ever storing them on disk.
Terraform output streamed line-by-line via Socket.IO as it runs.
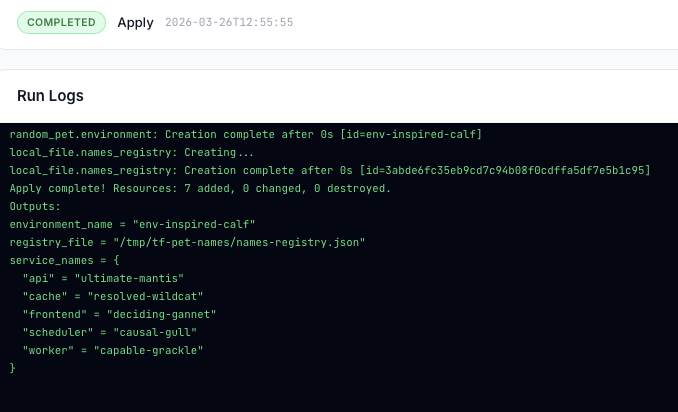
Full apply output in real time with cancel button available.
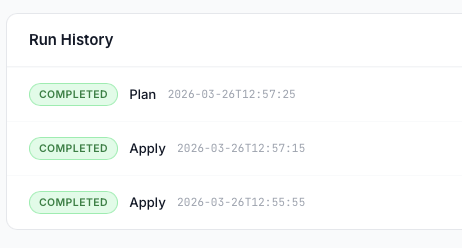
All past executions with status, duration, and persisted logs accessible at any time.
Pick any local or remote branch, tag, or release for each Run. Remote refs are fetched on demand. One-click checkout — no terminal needed.
Run labels show the exact branch/tag/commit used and whether a git pull was performed — the traceability TFE never gave you.
Manual git fetch button refreshes remote refs. Optional git pull before each plan or apply keeps the workspace in sync automatically.
Every Run shows every variable that was injected and its source: workspace group .tfvars auto.tfvars default — no guesswork about what ran.
Named sets of Terraform/env variables. Apply a group to any workspace, globally or scoped. Create, edit, delete, and see which workspaces consume each group.
Sensitive variable values encrypted at rest with Fernet. Optional portal password lock with auto re-encryption when the password changes.
Run counters, success/failure rates, plan duration trends, and resource change history — all at a glance per workspace.
Built-in /metrics endpoint compatible with Prometheus scraping. Push to InfluxDB or any compatible time-series backend.
Visual sparklines showing plan vs apply counts, error spikes, and average execution time over rolling windows — per workspace and globally.
Configure delivery channels (email, Slack, PagerDuty, Alertmanager, generic webhook) per workspace with trigger conditions: success, failure, drift, or all events.
Send on-call alerts directly to PagerDuty incidents or Alertmanager receivers. Include run log snippet, workspace name, and Git ref in every alert payload.
Every alert dispatched is recorded — channel, timestamp, trigger, delivery status. Full audit trail of who was notified and when.
Trigger plans, applies, and workspace queries via a documented REST API. Integrate TGM into CI/CD pipelines, scripts, or custom dashboards — no clicking required.
Generate scoped API tokens per team or integration. Tokens support read-only or full access. Revoke at any time from the Settings panel.
Subscribe to run lifecycle events (queued, running, completed, failed) via webhooks. Build automation workflows in n8n, Zapier, or custom services.
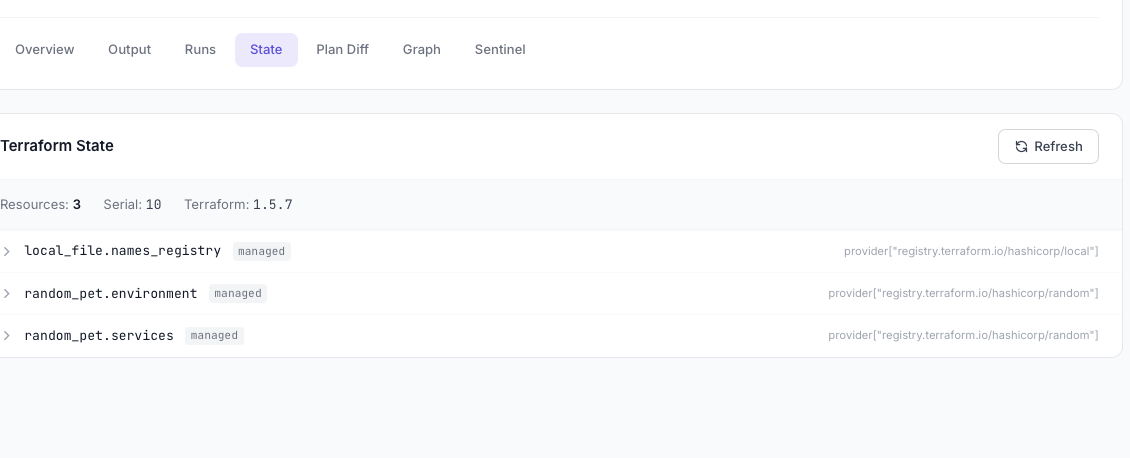
All resources in state with type, name, and module path.
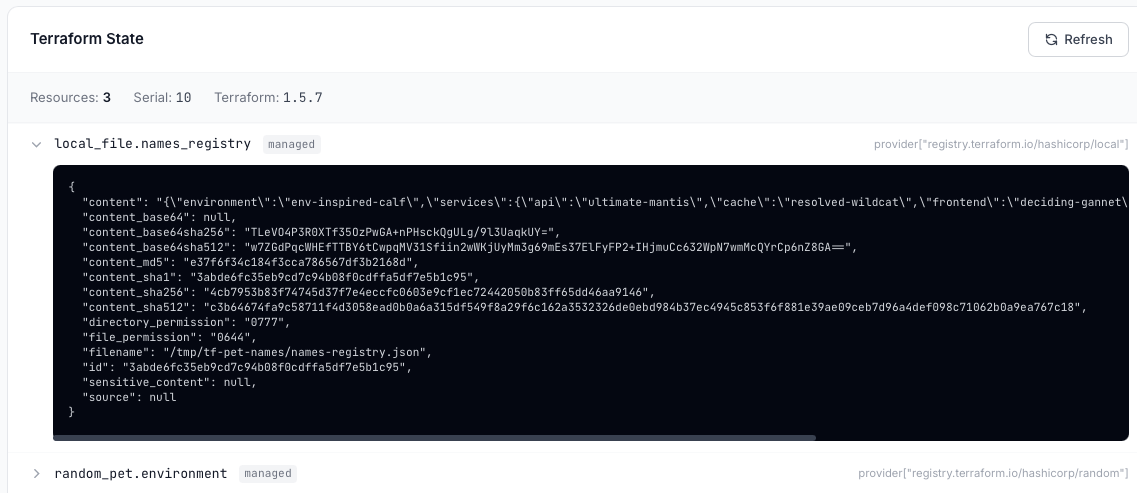
Expand any resource to browse its attributes. Sensitive values are masked automatically.
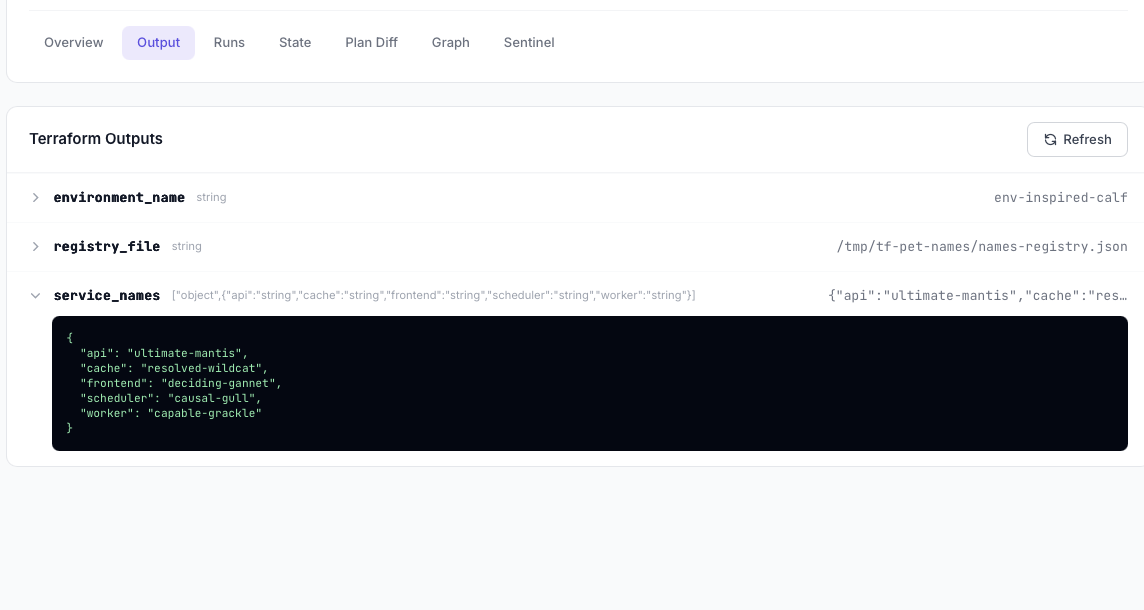
All terraform output values surfaced in the UI. Sensitive outputs shown as ***sensitive***.
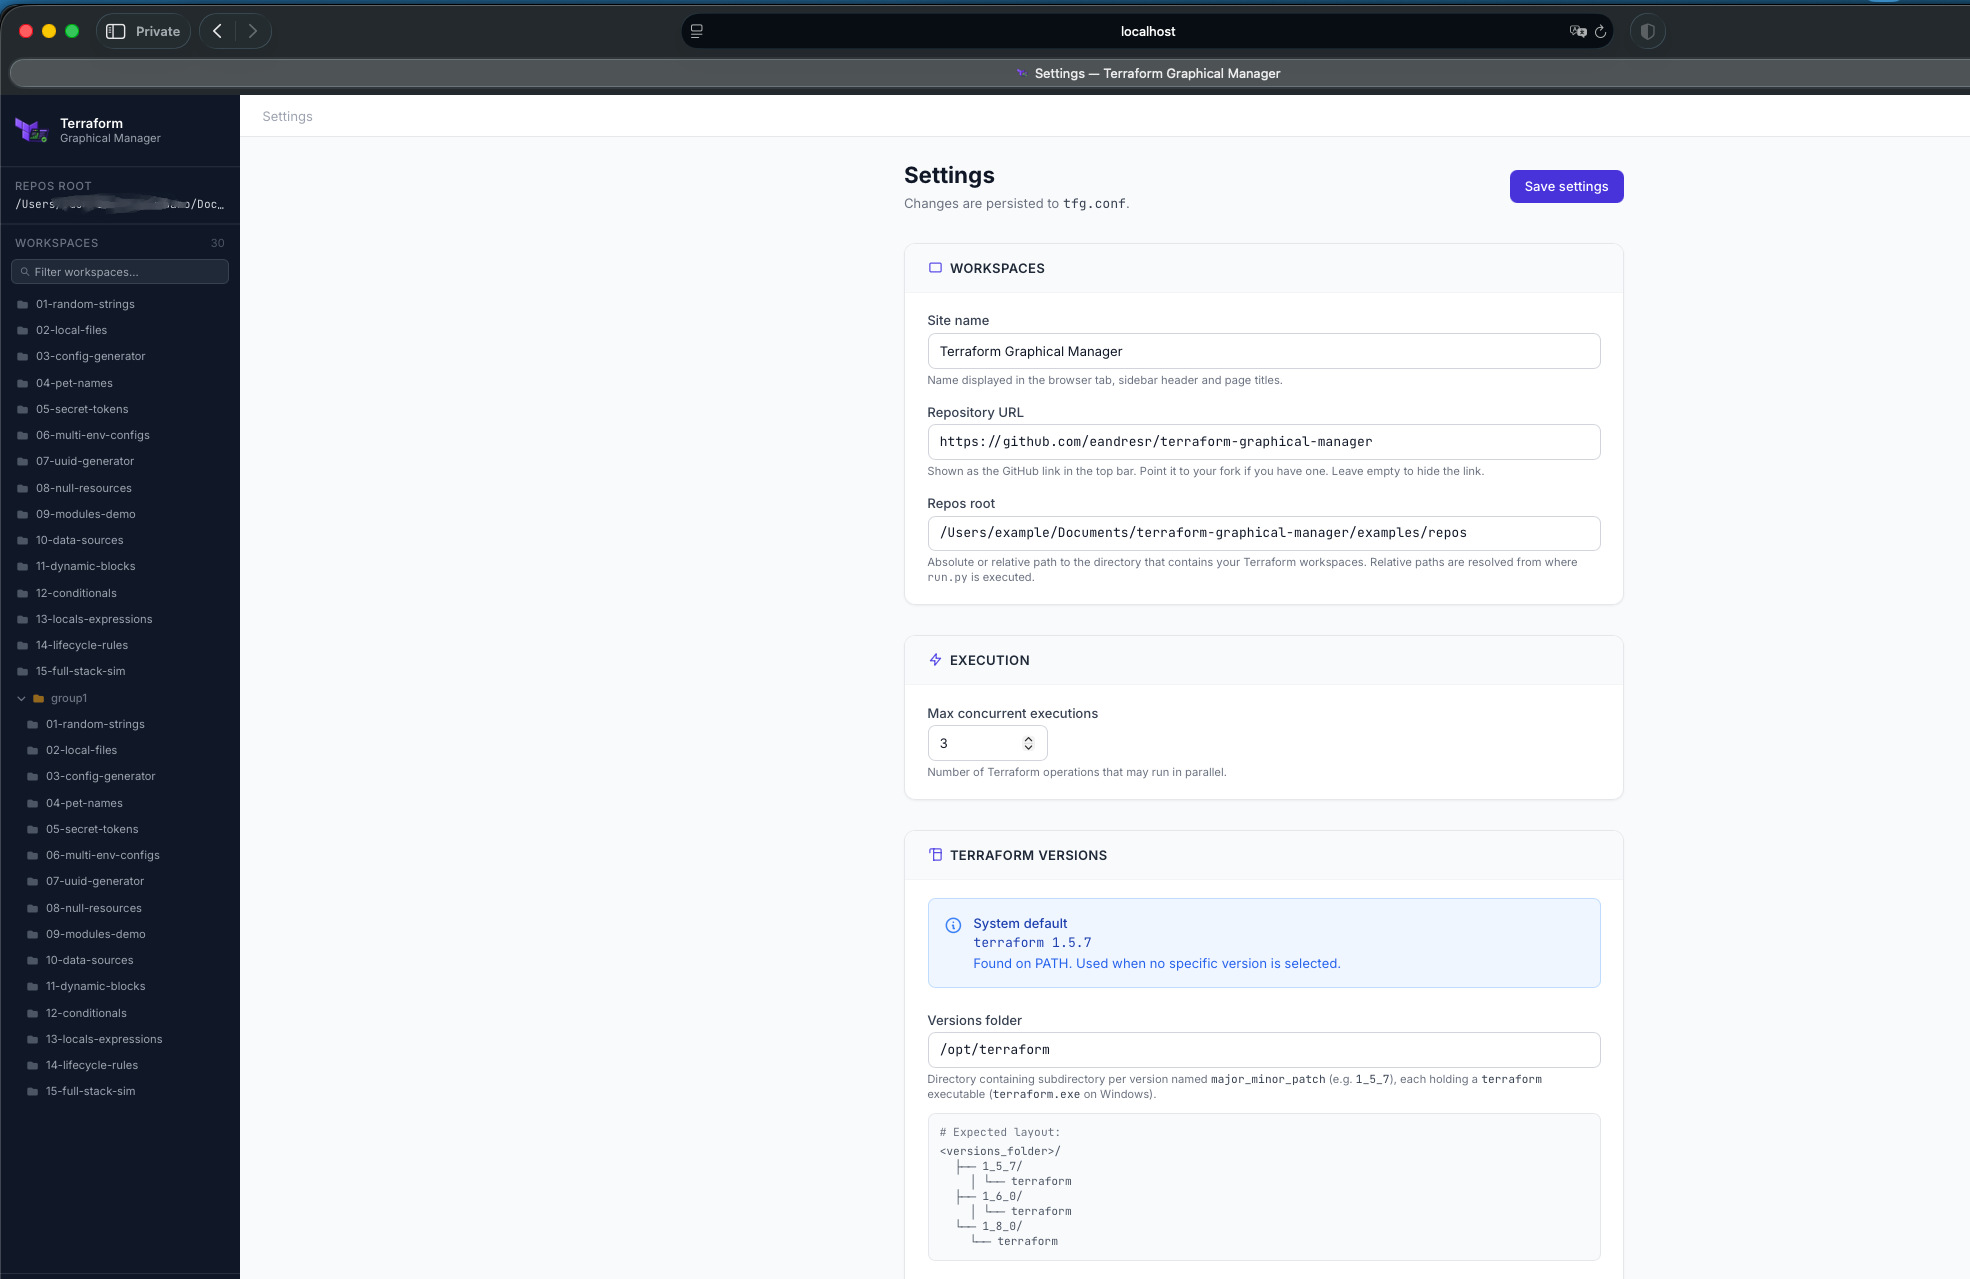
Edit all tfg.conf options through the UI — saved to disk automatically.
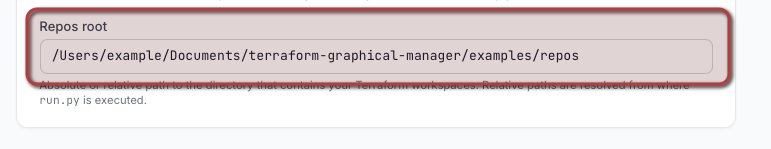
Configure the root path TGM scans for Terraform workspaces.
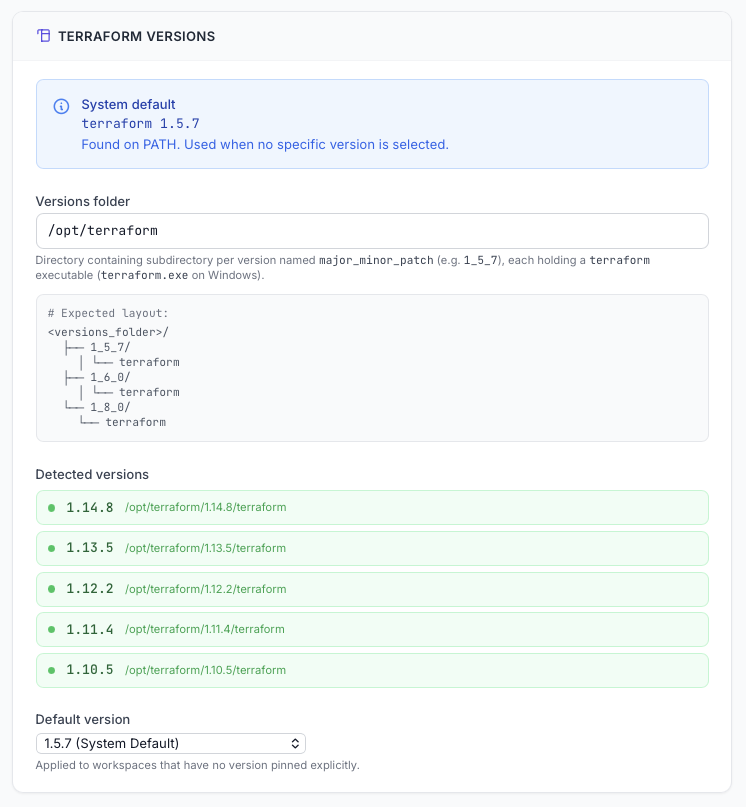
Detected local Terraform binaries listed with their version numbers.
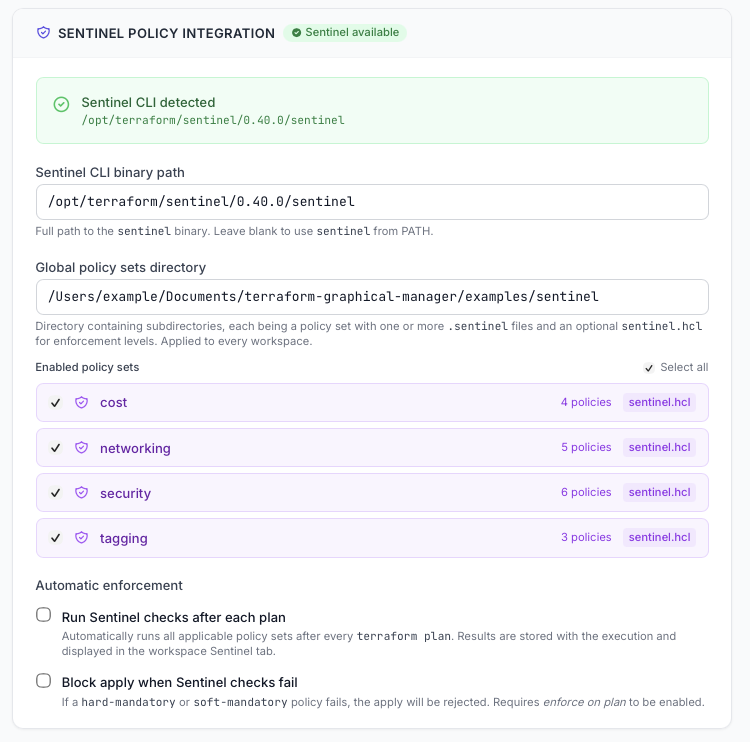
Discovered policy sets with per-set checkboxes to enable or disable globally.
Toast notification confirms settings have been written to disk.
Terraform Cloud keeps Git info buried. TGM surfaces it front and center — choose the exact ref before you run and see it stamped on every execution record forever.
Searchable dropdown listing all local branches, remote tracking branches, annotated tags, and GitHub-style releases. One click to switch the working ref.
Dedicated Fetch button syncs remote refs. Optional pull before run setting ensures the workspace is always on the latest commit before plan or apply.
Branch name, tag, and short commit SHA are persisted with each run. The run history shows main@a1b2c3d — not just a timestamp.
Personal access tokens for private repos resolved in order: environment variable → workspace variable → variable group. No hardcoding, no credential leakage.
TFE shows you that a Run used variables. TGM shows you which variables, what values (masked if sensitive), and which source provided each one.
Scoped to a single workspace. Stored in workspace_config.json, optionally encrypted.
Named set applied to one or many workspaces. Global or workspace-scoped. Edit once, apply everywhere.
Explicitly passed -var-file. Filename shown in the run record.
Automatically loaded by Terraform. Detected and surfaced in the run summary.
Variable not overridden anywhere — falls back to the default value declared in the module.
| Variable | Value | Source | Type |
|---|---|---|---|
region |
us-east-1 |
workspace | terraform |
environment |
production |
group: global-prod | terraform |
vpc_cidr |
10.0.0.0/16 |
prod.tfvars | terraform |
enable_flow_logs |
true |
networking.auto.tfvars | terraform |
AWS_ACCESS_KEY_ID |
*** |
group: aws-creds | env |
max_azs |
3 |
default | terraform |
Know exactly how your infrastructure runs — plan durations, error rates, drift frequency — and send it all to the monitoring stack you already use.
Expose a /metrics endpoint ready for Prometheus scraping. Add TGM as a target in your prometheus.yml in seconds.
Push run metrics directly to an InfluxDB bucket. Visualize in Grafana with the included dashboard template.
Forward metrics via StatsD UDP or HTTP push to any compatible backend — Datadog, New Relic, CloudWatch, and more.
GET /api/metrics
Prometheus text format
Route run status alerts to the right channel and the right person — automatically, per workspace, with full context in every message.
SMTP-based delivery. Configurable from/to addresses per workspace. HTML template with run summary and log excerpt.
Post to any channel or DM via incoming webhook or Bot token. Rich message block with workspace, Git ref, status, and duration.
Trigger, resolve, or acknowledge incidents via Events v2 API. Severity mapped from run status. Auto-resolve on retry success.
Push alerts directly to an Alertmanager instance. Labels include workspace, run type, and Git ref for fine-grained routing rules.
POST a JSON payload to any URL. Configurable headers, auth token, and payload template. Works with n8n, Zapier, Teams, and more.
Every action available in the UI is also exposed over a REST API. Build pipelines, write scripts, or integrate TGM into your existing tooling.
/api/workspaces/{id}/plan
Trigger a plan run
/api/workspaces/{id}/apply
Trigger an apply
/api/runs/{run_id}/cancel
Cancel a running job
/api/workspaces
List all workspaces
/api/workspaces/{id}/variables
Get variable config
/api/variable-groups
Create a variable group
/api/metrics
Prometheus text format
/api/runs/{run_id}/log
Fetch full run log
# Trigger plan on merge to main
curl -X POST \
  https://tgm.internal:5005/api/workspaces/prod-networking/plan \
  -H "Authorization: Bearer $TGM_TOKEN" \
  -H "Content-Type: application/json" \
  -d '{
    "git_ref": "main",
    "pull_before_run": true,
    "var_overrides": {
      "environment": "production"
    }
  }'

# Response
{
  "run_id": "run-a1b2c3",
  "status": "queued",
  "workspace": "prod/networking",
  "git_ref": "main",
  "queued_at": "2026-04-03T10:22:01Z"
}
Store the portal password in your company password manager (1Password, Bitwarden, HashiCorp Vault…). Every engineer on the team opens TGM with the exact same encrypted variable configuration — workspaces, variable groups, sensitive values — all in sync. No manual handovers, no configuration drift between teammates, and no extra SaaS bill. One shared key, consistent and auditable workflows across the whole infrastructure team.
Attach HashiCorp Sentinel policy sets to every workspace. Policies written for Terraform run without modification.
Python 3.9+ and Terraform CLI installed? That's all you need.
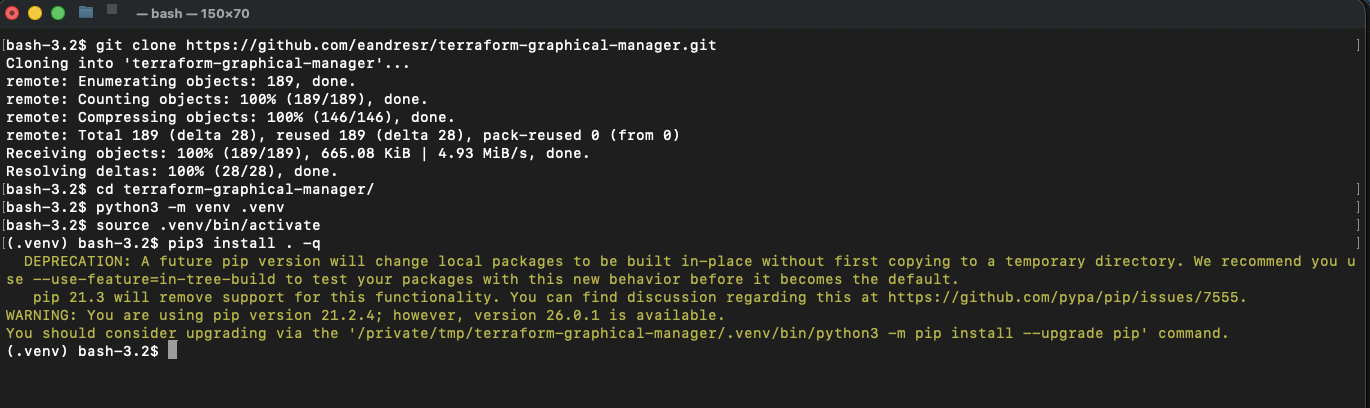
Clone the repository and install the tgm command with pip.
Copy the example config and set repos_root to your Terraform directories.
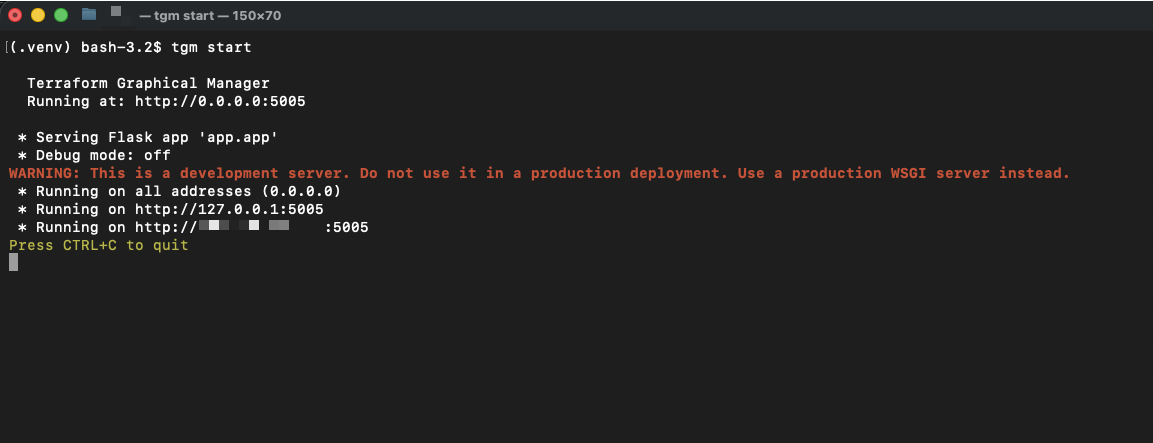
Run tgm start and open localhost:5005 in your browser.
TGM discovers all .tf files automatically — no manual registration needed.
# Clone
git clone https://github.com/eandresr/terraform-graphical-manager
cd terraform-graphical-manager

# Create and activate venv
python3 -m venv venv
source venv/bin/activate

# Install
pip install .

# Configure
cp config/tfg.conf.example tfg.conf
# edit tfg.conf → set repos_root

# Start
tgm start

# Open http://localhost:5005
Execution logs, plan artefacts, and run metadata are always persisted — locally or in cloud storage.
Default. Zero config. Data stored in ./TERRAFORM_GRAPHICAL_BACKEND/.
Set TERRAFORM_GRAPHICAL_BACKEND=aws and point to any S3 bucket.
Set TERRAFORM_GRAPHICAL_BACKEND=gcp with a service account credential.
Set TERRAFORM_GRAPHICAL_BACKEND=azure with a connection string.
TGM is MIT licensed and community-driven. Every contribution — code, bug report, or donation — makes it better for everyone.
Fork the repository, create a feature branch from main, and open a Pull Request.
Check the Contributing Guide
for the full workflow — including branch naming, PEP 8 style, and the PR checklist.
Found a bug? Open an Issue first so we can discuss the fix together.
TGM is free and will always remain free. If it saves you time or helps your team, consider
buying the maintainer a coffee.
Donations fund ongoing development, bug fixes, new features, and keeping the project alive for the community.
Free, open-source, and running on your machine in under a minute.